Who is missing from the dataset your analysis depends on?
A new genetic-regulation catalogue opens a coding discussion about sample representation, joins, missingness and the limits of an aggregate result.

The table can be enormous and still have a blind spot
A dataset arrives with millions of rows. Loading it takes time, the analysis runs without errors and the results look impressively precise. One question still comes before the model: which people and observations produced those rows? More records can improve an estimate while leaving an important part of the intended population poorly represented.
A Nature Genetics study published on 2 November examines genetic regulation in 1,882 Qatar Biobank participants. It combines blood RNA measurements, DNA sequencing and information on 45 traits. The researchers report 1,379 genes with regulatory associations absent from the comparison datasets. These are newly reported links between genetic variation and gene expression, not newly discovered genes. Studying an underrepresented population can therefore add findings that existing catalogues miss. Public summary statistics accompany the paper; participant-level records require reviewed access.
Source: Genetic-regulation catalogue, published 2 November 2026
A join is a scientific decision
A join combines tables using a shared key, such as a participant identifier. Consider a fictional community walking survey. One table contains identifiers and step counts, another contains questionnaire responses, and a third records which measurements passed quality checks. None contains genetic or medical data. This original exercise lets us see how a familiar software operation can change the population an analysis describes.
An inner join keeps only identifiers present in both inputs. That can be the intended operation, but it can also silently remove people who did not complete the questionnaire. Count participants before and after the join, then inspect which records disappeared. A successful merge means the software followed its join rule; it does not establish that the remaining sample answers the original question.
Check key uniqueness as well. If one participant has two questionnaire records, joining on the identifier alone can duplicate that person's step count. The resulting table may contain more rows and less independent information. Keep separate counts for rows, unique participants and repeated measurements. They describe different things, even when a chart labels all of them as sample size.
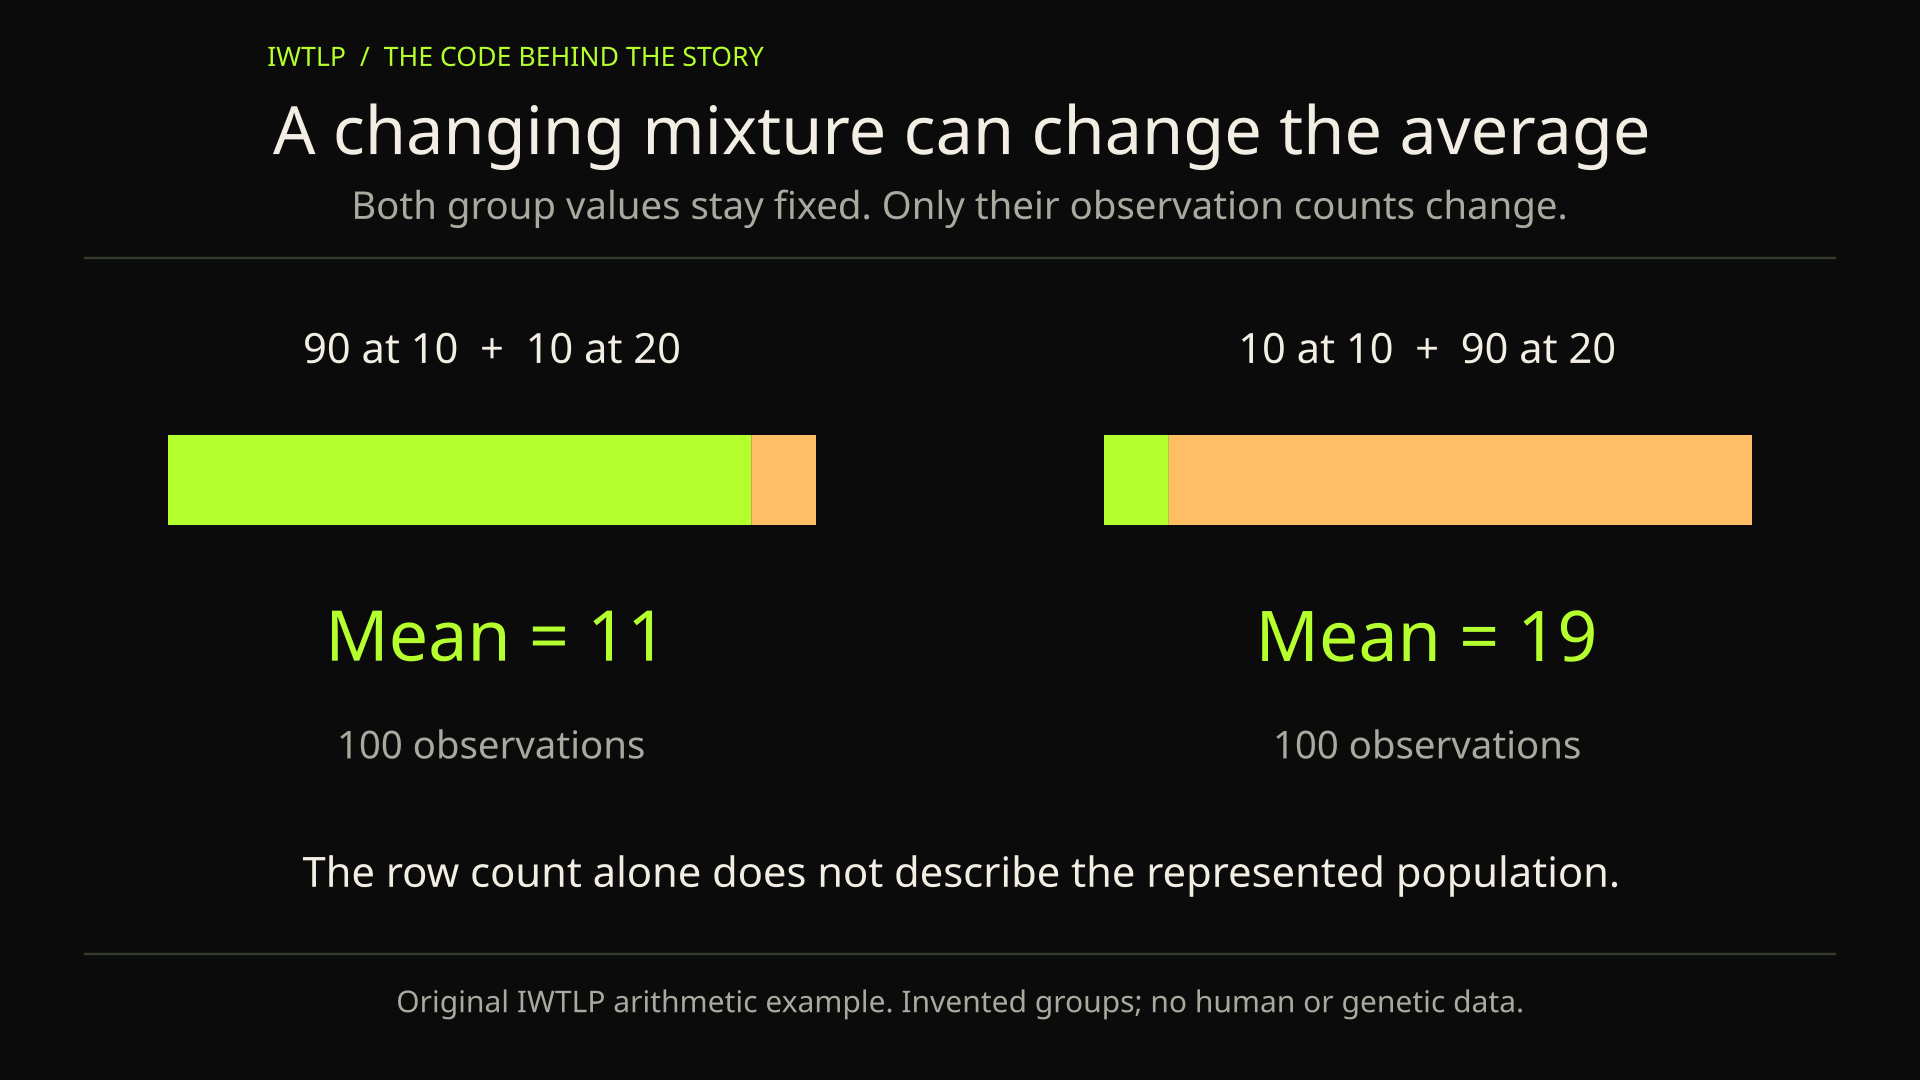
The average can change because the mixture changed
Here is a deliberately simple arithmetic example. A fictional dataset has ninety observations with value ten and ten observations with value twenty. Its overall mean is eleven. Reverse those counts while leaving every value unchanged and the mean becomes nineteen. Nothing about either subgroup's values changed. Only their representation in the combined dataset changed.
That example does not explain the biological findings of the new paper. It illustrates why an analysis should retain its sampling context. A combined statistic can reflect both within-group patterns and the mixture of observations. Deciding which distinctions matter requires domain knowledge; the code needs to preserve enough information for that decision to be examined.
Missingness deserves the same care. A missing measurement is not automatically a zero, and a failed quality check is not the same event as a participant declining a questionnaire. Assign distinct states before aggregation. Otherwise a convenient fill operation can turn several different reasons for absence into one invented observation.
Reproducible analysis has an access boundary
The study says it uses previously published analysis tools rather than newly developed custom tools. That makes it a useful reminder that computational work is broader than releasing a new library. Selecting cohorts, maintaining identifiers, applying quality rules and recording tool versions can be central to the meaning of the result.
Its public summary statistics also have a different scope from participant-level records. An aggregate table supports some comparisons while omitting information needed for others. An article or classroom exercise should state which layer it uses. There is no need to acquire restricted data to teach joins, missingness or representation; the fictional survey is sufficient for those mechanisms.
Before presenting the walking survey's average, write down how many people entered the analysis, how many remained after each join and why anyone was excluded. Check that repeated questionnaire rows did not give one person extra weight. These small checks help answer the question that began the story: whose experience does the final number represent?